Меню в шапке
Market research The state of the online cosmetics market for 2021
To buy the report
Contents of the report
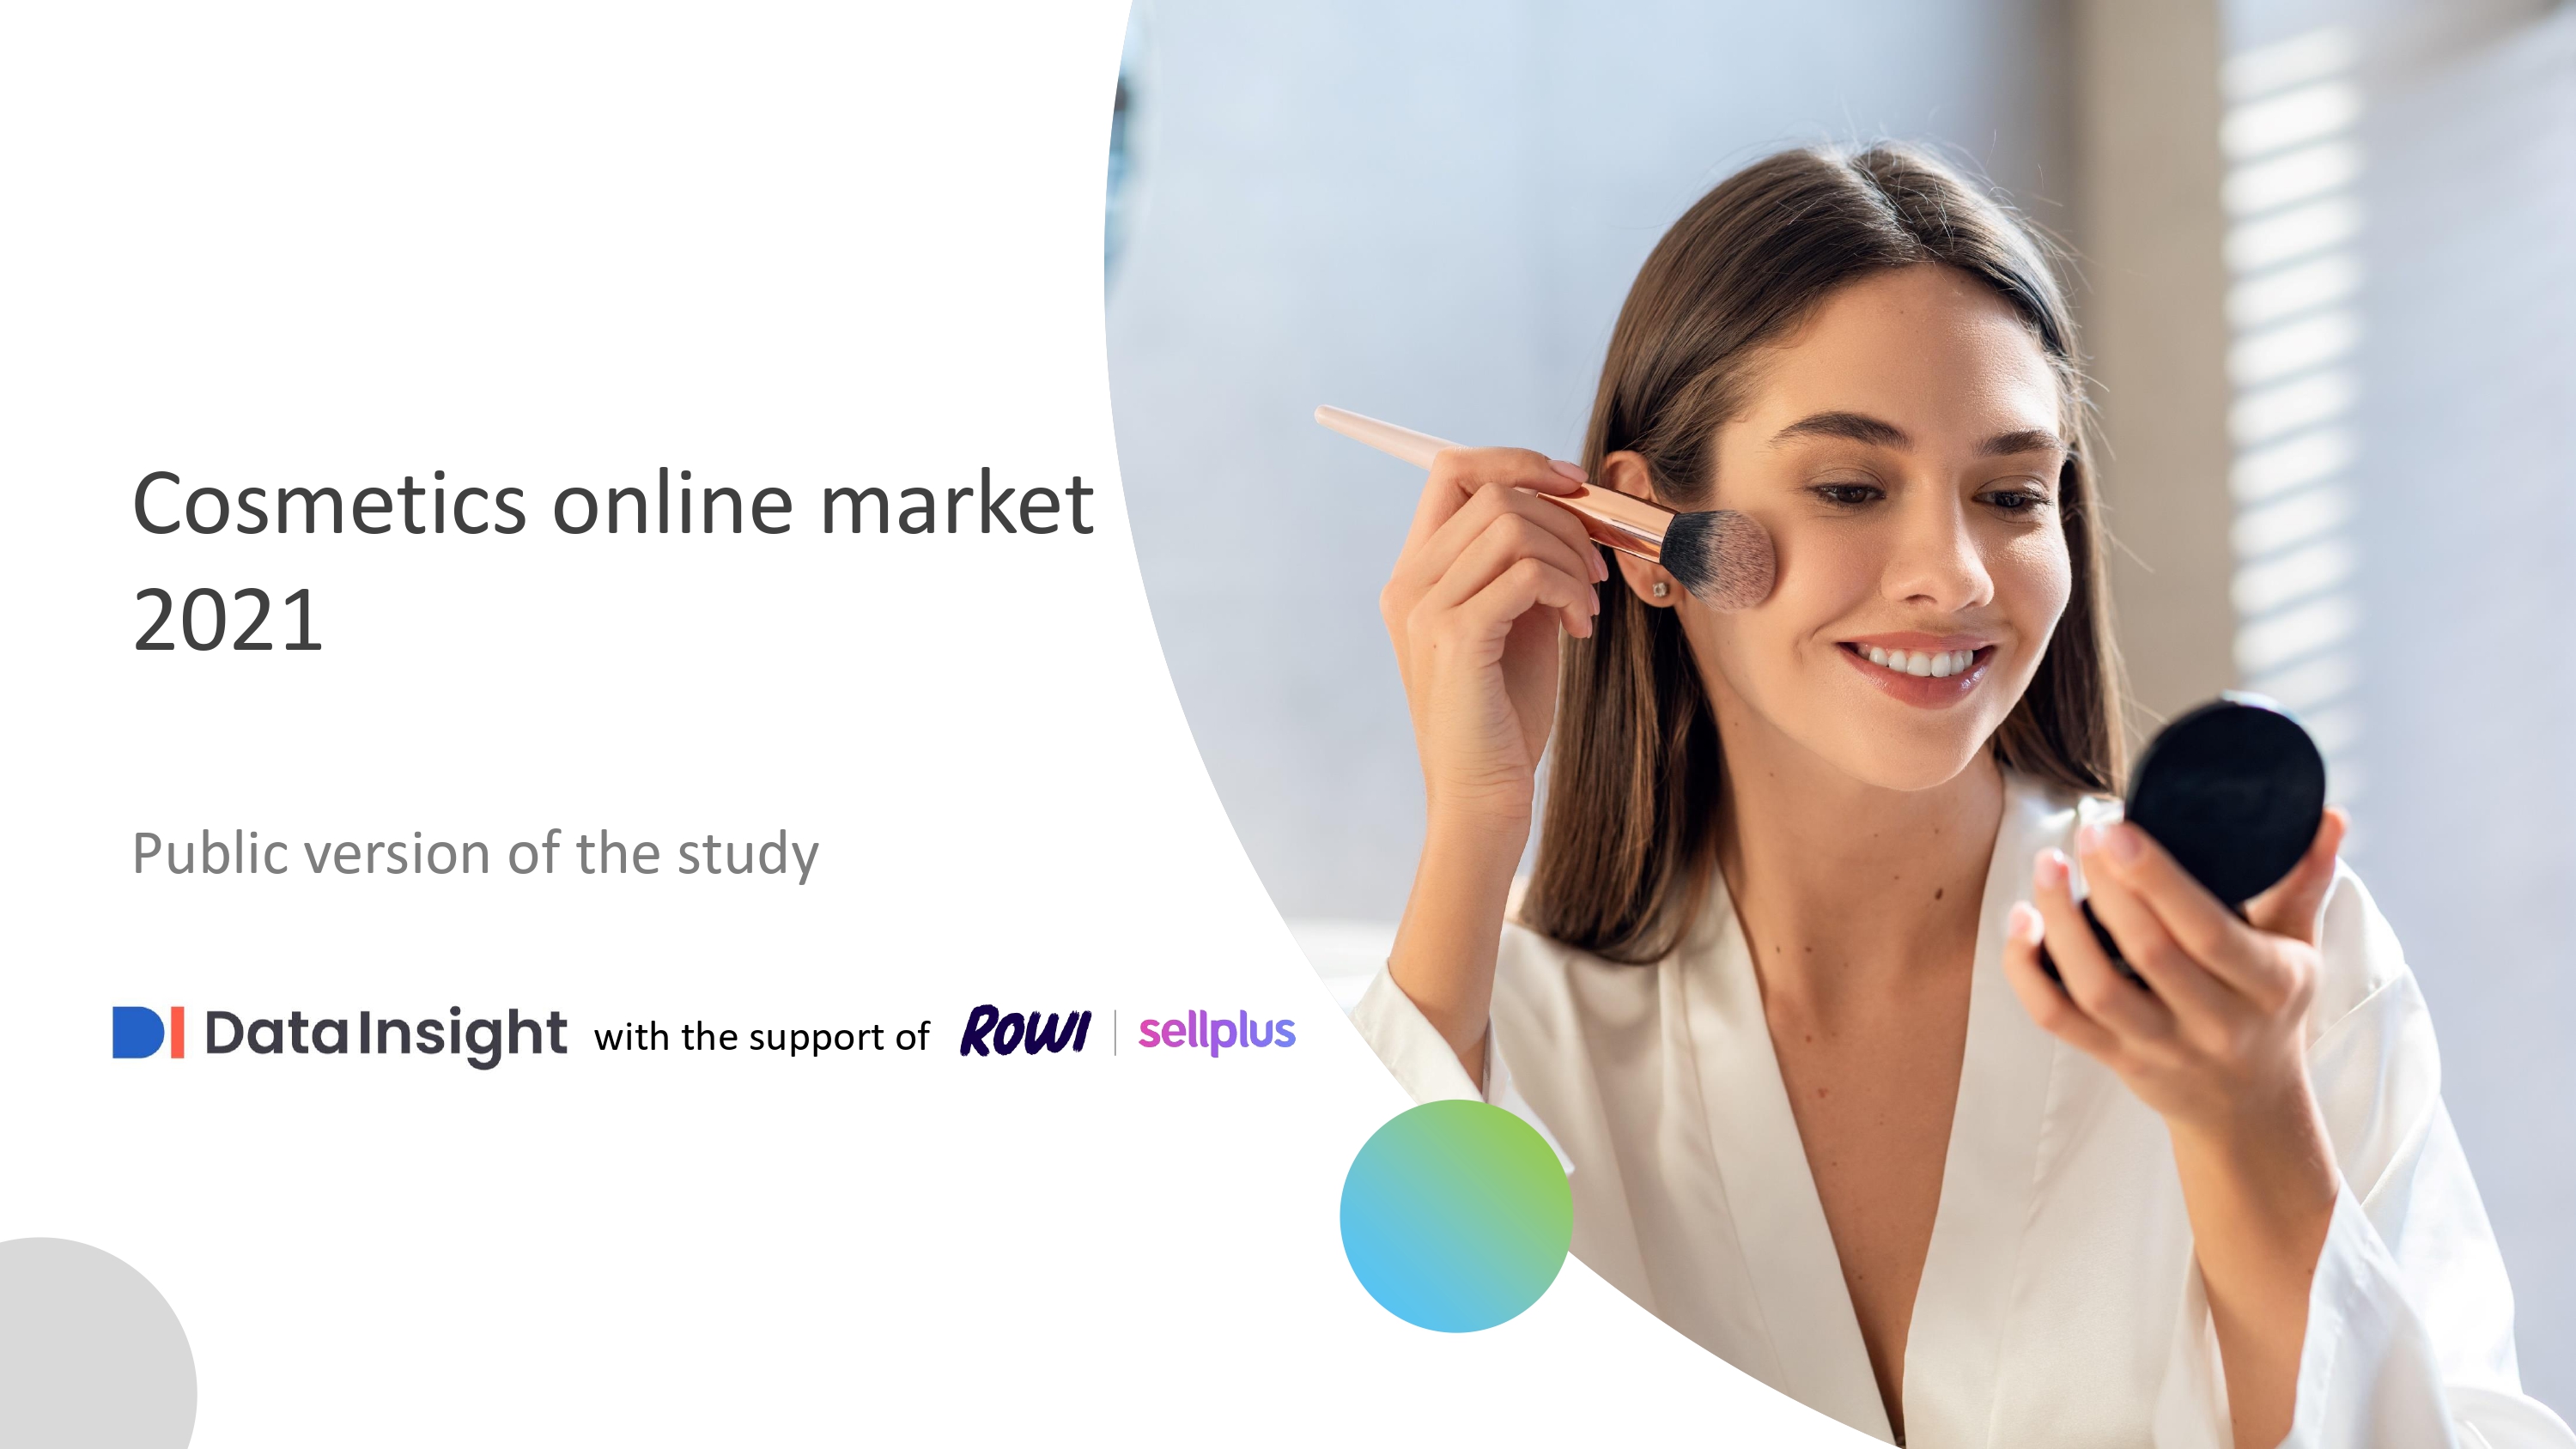
Data Insight, with the support of Rowi, is launching the study «The state of the online cosmetics market for 2021». The report examies online cosmetics market, i.e. online retailers selling makeup and skincare, perfumes, products for manicure, pedicure and make-up artists.
The key figures
- In 2021, 231 million orders were issued worth 211 billion rubles.
- The average bill was 915 rubles
- In 2021, online stores issued43% more orders than in the same period in 2020
- The share of orders of cosmetics amounted to 13% of the eCommerce market
- Sector conversion — 5%
The main conclusions
- In total, 231 million online orders worth 211 billion rubles were placed in the cosmetics segment in 2021.
- In 2021, the cosmetics segment grew by 43% in terms of money and by 86% in terms of orders. In terms of revenue growth, the segment ranks tenth out of twelve in the Russian eCommerce market, and seventh in terms of growth in the number of orders. Excluding universal marketplaces, the growth of the cosmetics segment was 10% in terms of money and 7% in the number of orders.
- Compared to 2020, the average check in the cosmetics segment decreased by 23% due to an increase in the share of marketplaces and in 2021 amounted to 915 rubles, which makes it the lowest average check in the eCommerce market. Excluding universal marketplaces, the average check in 2021 equals 3 050 rubles, which is 3% more than in the previous year
- The cosmetics market accounts for 13% of the Russian eCommerce market in terms of online orders and only 5% of total sales.
- The sector conversion amounts to 5%. The closest figures are for children's goods stores - 5.6% and clothing, footwear and accessories stores - 4.5%.
- Half (54%) of online sales and 86% of cosmetics orders account for two one-stop stores. The largest category (35% of all stores included in the study) - general stores - accounted for 24% of all online sales and only 6% of the segment's orders. Another 7% of stores are network marketing stores, accounting for 14% of online sales and 6% of orders. The second largest category (28%) - skin care stores - accounts for only 3% of online sales.
- 72% of the stores considered in the study are registered in Moscow or the Moscow region. Compared to 2020, the share of stores registered in the Asian part of Russia decreased by 5%.
- The structure of traffic sources in the segment of online cosmetics stores is characterized by an increased share of direct traffic (33% vs. 27% on average) and a reduced share of organic search (40% vs. 43% on average in the eCommerce market). In the structure of traffic sources in the cosmetics segment, the share of direct traffic increased by 7% over the year.
Extended research version
You can also buy an extended version of the research «The state of the online cosmetics market for 2021», which includes the following data:
- TOP10 by the number of orders
- TOP10 by revenue
- TOP10 by the number of visitors (with dynamics)
- Conversion to the TOP10
- Used technologies for TOP10 (CMS, e-mail, marketing services)
- Mobile traffic share in TOP10
- Mobile Apps Overview
- Share of promotion channels in TOP10 traffic
- Summary table with indicators for visitors, conversions, orders, average check and revenue for the TOP10
Full version size — 50 slides
Cost — 60 000 rubles, including VAT
The deadline for submission is 3 business days from the date of payment.
To buy the report
To learn more or order the full version, contact us in any way convenient for you: by phone: +7 (495) 540-59-06, by mail to coordinator@datainsight.ru or by filling out the form below
